Loop Gain, Delay and Oscillatory Breathing
A real exercise test
A 63-year-old man on a cycle ergometer, breathing into a mouthpiece. The work rate climbs smoothly throughout, so nothing is being applied to him in bursts. These are the two channels a routine test provides.
His ventilation does not settle, and his CO₂ follows the same rhythm in the opposite direction. The equipment is working normally and nothing is being applied to him at that rhythm. The rest of this page explains where the rhythm comes from.
1. Starting from an analogy
Exercise oscillatory ventilation is usually approached through respiratory physiology. It can be easier to come at it from the other direction, as a control problem, and doing that calls for an analogy: something familiar enough to be thought about in terms of inputs and outputs.
The analogy is not hard to find once EOV is described as a feedback loop that has fallen out of step. That phrasing will be familiar to anyone who has sat through a course in automatic control, where a standard remark is that any feedback loop, if it is affected by delay, can begin to oscillate. The usual classroom example is a house heating system. A shower works just as well and is more immediate.
The shower
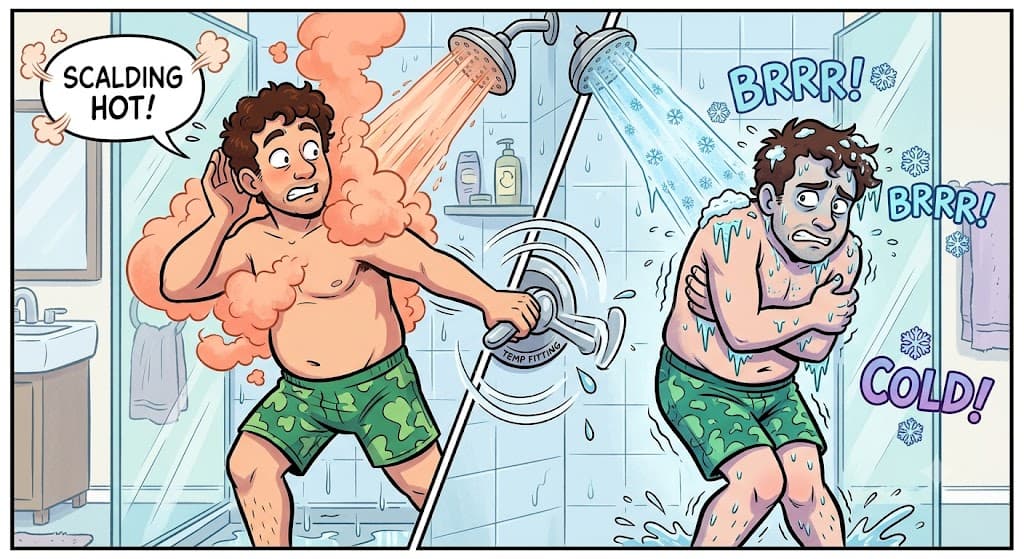
Imagine stepping into an unfamiliar shower. The water is too cold. Not knowing how this particular shower behaves, you move the handle gently towards the red mark. Nothing happens. You move it again in the same direction. Still nothing, so you move it further.
Then the water is scalding. You jump out of the way while the cubicle fills with steam, and you push the handle back towards the blue mark, this time with real force. A few seconds later the water is freezing. After a couple more iterations you settle on the position that gives the temperature you wanted in the first place.
Nothing in that system is broken. The tap works, the boiler works, and your skin reports the temperature accurately. The average temperature over five minutes would be close to correct. The problem is in the timing.
What is going on
You were regulating the temperature from what you could feel. The water you could feel, however, had left the mixer several seconds earlier. While you were still asking for more heat, hot water was already on its way to you. Every correction was applied to information that was out of date, and so every correction was too large.
Two things made that possible: how firmly the handle was moved, and how long the pipe is. Section 3 shows that neither of them on its own is enough.
The same structure in breathing
Ventilation is regulated the same way. It rises when the body senses a rise in CO₂, for instance as exercise intensity increases, and the extra ventilation clears CO₂ from the lungs. But the sensing does not happen in the lungs. The carotid bodies respond to CO₂ carried in arterial blood, which has to travel from the alveoli to the carotid body before it can be sensed at all. That journey takes time, and the control loop is closed around it.
In some conditions the journey takes longer than the control system behaves as though it does. In heart failure a reduced cardiac output slows the blood, so information about CO₂ arrives late: a shower with long, slow pipes. The chemoreflex may also be unusually sensitive and respond too strongly to a given rise in CO₂: an eager hand on the handle. Ventilation then rises in response to a CO₂ level that has already begun to fall. CO₂ drops further than it should, ventilation is withdrawn, CO₂ rises again, and the cycle repeats. When that pattern persists, it is what gets recorded as exercise oscillatory ventilation.
EOV during exercise carries an unfavourable prognosis in heart failure. Within the picture developed on this page, treatments that raise cardiac output or relieve congestion act on the loop itself rather than on the symptom, by shortening the delay and enlarging the CO₂ stores, both of which lower the loop gain. That is a consequence of the model rather than a clinical claim, and the rest of this page is about how much of it can actually be measured.
Before reading further, try the shower for yourself. The target is 38 °C and the water is currently too cold.
🚿 Setting the shower temperature
The target is 38 °C. The water is currently too cold. Turn the tap and keep the temperature at 38 °C for as much of the 60 seconds as you can.
2. Open loop and closed loop
Before going any further it is worth being precise about what kind of system this is, because it is the structural idea the rest of the page depends on.
An open loop runs in one direction:
tap position → water temperature
Set the tap and the temperature follows. Nothing the temperature does affects the tap.
A closed loop feeds the output back to the input:
tap position → water on your skin → your hand → tap position
In both cases the water takes time to travel down the pipe. That delay is a property of the plumbing and it is there whether or not anyone is listening.
The difference is that the output becomes part of the input. You are not setting the tap once. You are continuously setting it based on the result of your own previous settings.
Almost every physiological regulator is closed in this sense, and so is the respiratory control system. Once a loop is closed, its behaviour is no longer a property of any single component. It is a property of the whole loop, including how long the signal takes to travel around it.
3. Why oscillation happens
The obvious explanation for the shower is that you were too heavy-handed with the tap. That is part of the answer but not all of it, and the missing part matters.
A heavy hand on its own does not cause oscillation. Suppose the mixer were at the shower head, so the water responded instantly. You could turn the tap as hard as you liked, feel the result immediately and stop. The temperature would not overshoot, because the information you need arrives before you have time to make things worse.
A long delay on its own does not cause oscillation either. Suppose the pipe were twenty seconds long but you only ever moved the tap a fraction at a time. The temperature would drift slowly to where you wanted it and stay there. Late information is harmless if nobody acts on it forcefully.
Oscillation becomes more likely when a strong corrective response acts through a sufficiently delayed system. Neither ingredient on its own is enough. In a real respiratory system the delay, the two gains and the damping of the CO₂ stores all interact, so this is the shape of the mechanism rather than the whole of it.
This explains what happened in the shower. When the water at your skin is cold, the water you have already asked for is still in the pipe and you cannot feel it yet, so you keep turning. By the time it arrives you have asked for far more than you needed, and the same thing then happens in the other direction. Each correction is appropriate for a situation that has already passed.
The strength of the correction as it travels once around the loop is called the loop gain. If a disturbance comes back around the loop smaller than it started, the oscillation dies away. If it comes back the same size or larger, it does not.
The loop has four parts, and the same four appear for the rest of this page.
4. The three parts of the loop
Everything this loop does is set by three quantities. Two of them say how strongly it reacts, and the third says how late the reaction arrives.
| The shower | Breathing | |
|---|---|---|
| Plant gain Gp | °C the water changes per notch of tap | mmHg the CO₂ falls per L/min of ventilation |
| Controller gain Gc | notches you turn per °C you feel wrong | L/min of ventilation per mmHg of CO₂ |
| Loop gain LG | Gp × Gc | Gp × Gc |
The two gains multiply, and multiplying them cancels the units:
(°C per notch) × (notches per °C) leaves a pure number.
That pure number is the loop gain. Neither factor on its own is easy to compare between two people, because one is in mmHg per litre and the other in litres per mmHg, and both depend on how hard the person is working. The product carries no units at all, which is what makes it comparable, although whether two such numbers really are comparable still depends on the operating point, the frequency and the measurement method.
The third quantity is the delay, and it works differently. It does not change how strongly the loop reacts, only when the reaction lands.
What each factor is
In the shower, the plant is the plumbing. A sensitive tap has a high plant gain: a small movement changes the temperature a lot. A worn tap that has to be turned a long way has a low one. Neither is faulty. They are different taps.
In the shower, the controller is the person. It is how far you turn the tap per degree of error you feel.
In respiratory control, neither block corresponds to a single organ. The plant is the whole dynamical relationship between the controller's output and the variable the controller senses, which includes the lungs, the CO₂ stores of blood and tissue, and the circulation that carries the signal. The controller is chemoreflex dynamics rather than a person making decisions. "Plumbing" and "person" are useful labels for learning the structure, not a description of the anatomy.
In a person, the equivalent of the tap is breathing and the equivalent of the water temperature is CO₂. Plant gain is approximately the mean CO₂ divided by the mean ventilation, so it falls as ventilation rises. Someone breathing 8 L/min at rest has a sensitive plant, because each extra litre changes their CO₂ noticeably. The same person exercising at 40 L/min has a less sensitive one. In resting heart failure the measured plant gain is about 0.89 mmHg per L/min, and during exercise about 0.48. Alveolar ventilation roughly triples from rest to exercise, which accounts for most of the difference.
Try it
Three controls: how sensitive the plant is, how hard the controller corrects, and how long the delay is. The product of the two gains is shown in the middle. The controls are labelled for breathing, and the toggle at the top relabels the same model as the shower.
One loop, three controls
Moving either gain changes their product. In this teaching model the delay mainly controls the cycle length and the gains mainly control the size of the swings.
Illustrative values. Not reference values for clinical interpretation.
A teaching model rather than a physiological simulator. It is built so that the delay and the gains act separately, which makes the two ideas easier to see. In a real system they interact, and none of the numbers below is a physiological constant.
A property of the body rather than of the controller, so nothing turns it. Sliding it changes how closely the graduations on the dial are spaced.
Grab a handle and turn it, or focus it and use the arrow keys.
A single disturbance at 60 s, such as a sigh, and nothing after it. A loop below 1 settles eventually; the loop gain decides how long that takes.
In this simulator the gains and the delay act separately: the gains set the size of the swings and the delay sets the cycle length. That separation is a property of the teaching model rather than of a real delayed loop, where the two interact. Section 5 says more about where the delay actually goes.
5. Stability does not mean silence
This is probably the most useful idea on the page, and it is the one most often lost when oscillatory breathing is described as either present or absent.
Three words tend to be used as though they were interchangeable. They are not, and almost everything in this section depends on keeping them apart.
| Term | What it means |
|---|---|
| Oscillation | The signal goes up and down. |
| Resonance | The system amplifies disturbances at some frequencies more than others. |
| Instability | A disturbance grows rather than decays. |
Stability tells you whether an oscillation grows or decays. It does not tell you whether an oscillation is present. A system can be stable, resonant and continuously oscillating at the same time.
A loop gain below 1 does not mean there is no oscillation. It means that a single disturbance dies away instead of growing. Whether anything is oscillating at any given moment depends on whether the system is being disturbed, and real systems are disturbed constantly.
A shower is never perfectly steady, and breathing is never perfectly regular, so the loop is disturbed all the time. It responds most to disturbances arriving near the frequency at which its own delay has brought the returning signal into step with the disturbance that produced it. Near that frequency the response is amplified, by roughly
1 / (1 − loop gain)
which is about 1.3 times at a loop gain of 0.22, 2.4 times at 0.58 and 10 times at 0.9.
That expression is the intuition rather than the complete description. Writing the loop gain as a single number hides the fact that it is a property of one frequency. The delay has not disappeared from the problem: it is what decides which frequency the loop responds to most strongly, while the gains decide how large that response is. A full treatment needs the magnitude and phase of the loop at each frequency, which is not necessary here.
Switching the simulator to continuous disturbance shows the consequence: a visible oscillation in a system that is formally stable. It wanders rather than keeping strict time, because it is driven by noise rather than sustaining itself. A truly self-sustaining oscillation is regular. Real recordings usually are not.
Note also how modest the effect is at a loop gain of 0.58. The response is concentrated in a narrow band of frequencies rather than dominating the recording. Raising the loop gain towards 1 makes it emerge from the background.
6. Same output, different mechanism
Consider two bathrooms that produce identical temperature recordings, with the same cycle length and the same size of swing.
- Shower A has a sensitive tap and a person who moves it gently.
- Shower B has an insensitive tap and a person who moves it a long way.
Their loop gains are equal, because a high plant gain times a low controller gain equals a low plant gain times a high controller gain. The "same swing, two causes" button in the simulator shows this. The two traces lie on top of each other while the underlying values are quite different.
Two systems can produce the same observed oscillation while having different plant and controller gains. A single output trace cannot tell you which of them produced it. Separating the two requires measuring one of the factors independently.
This matters clinically because the two cases would call for different treatment. One would need the plant changed, the other the controller. It also explains why a second measurement channel is valuable, which is the subject of section 7.
Ventilation changes constantly during exercise with workload, breathing pattern, effort, swallowing, speech and metabolic transitions. Exercise oscillatory ventilation refers to a sustained, recurring pattern that cannot be explained by the change in work rate or by ordinary breath-to-breath variability. Real recordings contain plenty of movement that is not this.
7. Reading the loop from a CPET
Section 1 set out the correspondence in words. The simulator makes it literal: the toggle relabels the same model as a shower and back again, and nothing else changes. Even the numbers on the axes stay put, because 38 is a reasonable shower temperature in °C and a normal arterial CO₂ in mmHg.
A routine exercise test records ventilation and end-tidal CO₂ at the mouth. Those two channels are enough to read the parts of the loop, but only if the oscillation is really a resonance in the first place. A large swing on the trace is not enough on its own, because slow drifts, changes in effort and measurement artefacts all produce something that looks like a swing.
Three things together are much more convincing:
- A narrow peak in the frequency content. The variation is concentrated near one cycle length rather than spread across many.
- Coherence between the two channels. Ventilation and CO₂ vary together at that same cycle length, rather than one of them wandering alone.
- The phase a negative feedback loop would produce. Breathing more removes CO₂, so the two should sit close to opposite, and the departure from exactly opposite is itself informative.
The same recording, with the measurements
A 63-year-old man on a cycle ergometer. The quantities below are measured directly from these two traces.
The CO₂ sits 153° away from his ventilation rather than the 180° of an exact mirror. That shortfall carries information about the effective delay around the closed loop. Turning it into a number of seconds is a model-based inference rather than a direct measurement, because lung mixing, the gas stores, chemoreceptor dynamics and the measurement itself all contribute to it.
This recording satisfies all three. The variation is concentrated near a cycle length of 36.5 s, the two channels vary together at that cycle length, and the CO₂ sits close to opposite the ventilation.
From there the three parts of the loop follow. The plant is the block turning ventilation into CO₂, so it can be estimated from the two traces directly. The loop gain comes from the size of the resonance. The controller gain is then whatever is left over:
Gc = loop gain ÷ plant gain
The plant is estimated from the two measured signals. The loop gain is estimated from the resonance. The controller gain is calculated from those two estimates and inherits the assumptions of both. No instrument is placed on the respiratory centre. Published methods generally recover at most two of the three quantities, so the third has to be assumed, and it is worth knowing which one that is before quoting any number.
Two assumptions are worth naming. End-tidal CO₂ is not the arterial CO₂ the chemoreceptors actually sense; it is a usable stand-in. And the phase needs the most care of all. The CO₂ here sits about 153° from the ventilation rather than at exactly 180°, and that shortfall carries information about the effective delay around the loop, but turning it into a number of seconds is a model-based inference. Lung mixing, the gas stores, the dynamics of the chemoreceptor response and the measurement itself all contribute to it. The phase is observed. The circulation time is inferred.
8. What the numbers mean
The textbook account of oscillation says it occurs when loop gain reaches 1, the point at which a disturbance exactly replaces itself. Measured values in patients are lower than that.
| Cohort | Loop gain |
|---|---|
| Cunha 2023, 250 exercising patients | 0.222 ± 0.193 (range 0 to 0.915) |
| Sands 2017, 25 heart-failure patients at rest | 0.43 ± 0.21 |
| An exercising cohort of ours (n = 26, unpublished) | 0.58 ± 0.15 |
None of these averages is close to 1, and the highest single value among 250 patients was 0.915. On these measurements oscillatory breathing is usually a lightly damped resonance rather than a self-sustaining instability, which is the practical form of the point made in section 5.
That matters for anyone calculating a controller gain. Assuming a loop gain of 1 in order to solve for it, which is what the shortcut Gc = 1 ÷ Gp does, means dividing by 1 where the divisor should be closer to 0.58. Controller gains obtained that way come out roughly 1.75 times too large, and the assumption leaves a recognisable trace: a loop gain of exactly 1.000 in every patient measured, which restates the input rather than reporting a result.
Read this way, loop gain is a continuous measure of how strongly the system resonates rather than a label for a pattern that is present or absent. That is a proposal about how to describe the phenomenon, not an established clinical standard.
The patient at the top of this page has a cycle length of 36.5 s. A widely used clinical definition of exercise oscillatory ventilation requires a cycle length between 40 and 140 s, so the rule applied as written returns no oscillatory ventilation. This is not an argument that the rule is wrong. The rule answers a yes-or-no question using thresholds chosen for reproducibility, while the signal still contains a measurable resonant response whichever side of the threshold it falls. "No oscillation seen" and "no resonance present" are different statements.
A high plant gain is sometimes read as a sign that the lungs are the problem. It is a physical property rather than a fault, and everybody has one. What determines the strength of the feedback is the product of the two gains. A sensitive plant with a low controller gain behaves perfectly well.
Relevance to this course
Most models in this course map an input to an output. This one connects the output back to the input, which produces behaviour an open-loop model cannot: a system that is accurate on average while being wrong at almost every individual moment.
It is also an example of the difference between what is observed and what is inferred. The traces are data. The loop, its gains and its delay are a model imposed on those data, and the model is useful precisely because it makes claims that could turn out to be wrong.
What comes next
The harder question is how these quantities are estimated from a real cardiopulmonary exercise test. That reduces to three questions about the recording:
- Where is the resonance?
- How strong is it?
- What does its phase tell us?
Each of those needs a method, and each method rests on assumptions worth setting out in full. That belongs in a separate methods document.
Sands SA, Mebrate Y, Edwards BA, et al. Resonance as the mechanism of daytime periodic breathing in patients with heart failure. Am J Respir Crit Care Med 2017;195(2):237–246. doi:10.1164/rccm.201604-0761OC. The resonance argument, and measurements of plant gain, controller gain, both delays and loop gain in 25 heart-failure patients using dynamic inspired CO₂. The loop gain framework used on this page is theirs.
Cunha GJL, Maltês S, Rocha BML, et al., Agostoni P. Beyond exercise oscillatory ventilations: the prognostic impact of loop gain in heart failure. Eur J Prev Cardiol 2023;30(6):498–505. doi:10.1093/eurjpc/zwad021. Loop gain measured from the resonance in 250 exercising patients, with the finding that a binary classification of oscillatory ventilation loses statistical significance once loop gain is included in the model.
Khoo MCK, Kronauer RE, Strohl KP, Slutsky AS. Factors inducing periodic breathing in humans: a general model. J Appl Physiol 1982;53(3):644–659. doi:10.1152/jappl.1982.53.3.644. The original multi-compartment model, which predicts oscillation from assumed parameters rather than measuring it. Its controller gain is a modelled steady-state slope rather than the frequency-specific gain discussed here, and the two are not interchangeable.
Hall MJ, Xie A, Rutherford R, Ando S, Floras JS, Bradley TD. Cycle length of periodic breathing in patients with and without heart failure. Am J Respir Crit Care Med 1996;154(2 Pt 1):376–381.
Francis DP, Willson K, Davies LC, Coats AJ, Piepoli M. Quantitative general theory for periodic breathing in chronic heart failure and its clinical implications. Circulation 2000;102(18):2214–2221. doi:10.1161/01.cir.102.18.2214
Sands SA, Edwards BA, Kee K, et al. Loop gain as a means to predict a positive airway pressure suppression of Cheyne-Stokes respiration in patients with heart failure. Am J Respir Crit Care Med 2011;184(9):1067–1075. doi:10.1164/rccm.201103-0577OC
Delos JB. A mathematical model of Cheyne-Stokes or periodic breathing. Math Biosci 2024;378:109318. doi:10.1016/j.mbs.2024.109318. Round-trip delays recovered from apnoea timing: 5 to 20 s in healthy adults, 20 to 31 s in heart failure.
Dhakal BP, Lewis GD. Exercise oscillatory ventilation: mechanisms and prognostic significance. World J Cardiol 2016;8(3):258–266. doi:10.4330/wjc.v8.i3.258. A review of the visual definitions referred to above, which originate with Kremser 1987 (amplitude above 15% of resting ventilation for at least 66% of the test), Ben-Dov 1992, Corrà 2002, Leite 2003 and Sun 2010 (at least 3 cycles, amplitude above 30% of mean ventilation, cycle length 40 to 140 s).
For the modelling background, see Module 4 on dynamic systems and first-order differential equations.